| JOURNAL 2020 |
| North Craven Heritage Trust |
The Ancient Parish of Giggleswick in North Craven comprised the townships of Giggleswick, Langcliffe, Rathmell, Settle and Stainforth, all of which were manors, Giggleswick and Settle being the larger ones (Figure 1). Apart from the Domesday book and tax records there is little information on life in these places before the 1500s. From then on there are manorial records, deeds, wills and the Giggleswick Parish Register as important sources of information [www.dalescommunityarchives.org.uk]. At the time of the Dissolution of the monasteries by Henry VIII and beyond, life began to change as both secular and religious matters had an impact on ordinary people. Speculators took the opportunity of buying, as investments, manors previously owned by abbeys and others; they later came to sell manorial rights to individual tenants as the feudal system came to an end. The sixteenth century was a turning point in religious attitudes and in terms of assertion of individual rights and freedoms. Family life must have been affected in various ways, as indicated by a detailed study of matters of birth, marriage and death in Tudor times [Cressy, 1999].
In recent years this Journal has published a variety of articles on wills, mortality, medical men, illnesses and disease. At the risk of seeming obsessed with these somewhat morbid topics, aspects of the lives of women and children in Tudor times (specifically the reign of Elizabeth 1558-1603) are considered in this article. A study has been made using the transcribed parish register for the Ancient Parish of Giggleswick [Hoyle, 1984] (Figure 2 copyright North Yorks. County Record Office, not allowed on-line). For Giggleswick, luckily, we have more complete data for this period than for many other parishes in England. A check on 44 English counties shows that Essex, Sussex, and Norfolk together have about 400 detailed parish registers (listing baptisms/births, marriages and burials) covering the period of Elizabeth’s reign; 10 more counties have about 10 to 20 registers each, and the rest only 0 to 4. Yorkshire has 23 registers for this period. A study carried out by the ‘Cambridge Group for the history of population and social structure’ [Wrigley et al.,1997] considered 404 parishes in detail to reconstitute family relationships, (very few of which parishes are in Northern England, and none in Craven), in which study problems and limitations are fully explored.
Apart from the registers, all the records are male dominated. For the most part it was men who made wills. Unmarried women and widows also could make wills, but rarely wives. The property of wives, generally speaking, was owned by the husband [Moody, 2019]. The inventories of goods held by the testator usually reflect the contents of households — the kitchen gear, bedding, and food in particular being the responsibility of the wife. The manor court had to be attended by tenants over the age of twelve and most of these were male (80 to 90%). Women featured only if they were widowed (mainly) or unmarried tenants and if they were fined for misdemeanours. The cause papers were concerned with church matters and morality, and the behaviour of men and women was held to account by church courts — the cases typically concern tithe disputes, slander, immoral behaviour and immoderate language. There are two cases in Giggleswick concerning breach of faith and six about validity of marriage.
It is therefore mainly the parish registers which provide much of the information about women’s lives in the time of Queen Elizabeth. In 1538 Thomas Cromwell ordered that a register be kept in every parish — the book should be kept in a coffer with two locks, and every Sunday the incumbent or clerk (often illiterate) should enter all the baptisms, marriages and funerals of the previous week. People disliked the idea for they feared that Cromwell intended taxing these sacraments. (Indeed, in 1694 such a tax was levied to pay for war on France, and clerks sometimes made no entry to avoid this tax). Injunctions about keeping these registers were later issued by Mary and Elizabeth I. There was much slackness and carelessness in this task so many registers contain errors, omissions and gaps. We do not know who the Giggleswick churchwardens, curates or clerks were at this time, and deficiencies in the register do not coincide with the different periods of service of the vicars - John Nowell, Thomas Abbat, and Christopher Shute.
For Giggleswick we are fortunate in having records starting in 1558, when Elizabeth I again required a register of baptisms, marriages and burials to be recorded by the church authorities. They are virtually complete to 1603 (death of Elizabeth). We have the numbers of baptisms, marriages and burials, although finding the name of a person is not always possible through the sequence of baptism, marriage and death — either because the church failed on occasion to record data, or because a person moved from the parish (perhaps to get married elsewhere, to be taken away by parents, or to be educated or apprenticed), or died in another parish. We can have little confidence in added remarks about status, being subject to the whim of the clerk. If a person died, they could be noted as being ‘infans’ (infant), ‘puer’ (boy), ‘puella’ (girl), ‘filius’ (son), ‘filia’ (daughter), ‘gemelli’ (twins), ‘liberi’ (children), ‘notha’ (illegitimate), ‘iuvenis’ (young man), ‘adolescens’ (young man or woman), ‘discipulus’ (apprentice) ‘senex’ (old), ‘pauper’, ‘c(a)ecus’ (blind) — or usually not described at all. Occasionally a child might be noted as ‘illegitime nata’ with the mother’s name and possibly that of the father. Women could be noted as ‘ux’ (‘uxor’ — wife) and ‘vid’ (‘vidua’ — widow), ‘innupta’ (unmarried) or ‘extranea’ (from outside the parish). It has been suggested that the term ‘widow’ might have meant women past middle age who lived alone and had independent means [Wrigley, 1969]. Other females might be called ‘ancilla’ (maid servant). None were called ‘spinster’.
It is saddening to read some of the entries in the register, even 450 years later, with the mention of suicide, hanging or drowning and, of course, the numerous deaths of babies.
The procedure in this study was to start with a particular baptism entry, note all references to the person in the index of the parish register, and where possible set down the date of marriage, the spouse name and his/her location, the baptism date of a first child, and date of burial. In only a relatively few cases was all this information found — it was mainly partial. Four ten-year cohorts were chosen, 1558-1567/8, 1568-1577/8, 1578-1587/8, 1588-1597/8 (the calendar year ended in March at that time). For each ten-year cohort the information yield of full details was for males about 40% of the number of baptisms, for females about 50%, varying within each cohort period. It was easier to follow females since they were often noted as ‘wife of xxx’ at burial.
Tables 1 and 2 summarize all the data extracted. The numbers must be treated with some caution since the register is defective with errors and omissions. In general, a major problem is that, as far as numbers are concerned, the people baptized are not completely the same as those counted as married or buried and this leads to some error in the conclusions based on numbers alone. There are flows of people in and out of the parish. The information for the first cohort period 1558-1567/8 suffers from the ‘start-up’ problem, i.e. there are no baptisms prior to 1558 to which later burial dates relate. The 1558 record is short and probably incomplete.
Infants
About 2000 baptisms are recorded over 40 years. Baptism supposedly took place within four weeks of birth or a fine was payable [Gandy, 1989]. Unbaptized children could not be buried with church rites [Whiting, 1949]. The ones who died called ‘infans’ can be identified and counted. It is then seen that for the series of years 1560 to 1564 and for 1597 to 1602 there are no infants recorded as having died, yet for all other years we see numbers in the range 1 to 17 — the large numbers suggesting serious children’s contagious disease, since they are not always coupled with a large number of adult deaths. It is beyond belief that no infants died in these two short periods — they were simply not identified. The recording clerk just did not use the term ‘infans’ for 1560-1564; there are in fact numbers ranging from 0 to 5 infant deaths for 1558 — 1564 as judged by comparing baptism and burial lists for one, two and three years after baptism. Some of those labelled ‘infans’ are two or three years old. For burials in the 0 to 4 year age range there are 160 males and 110 females, total 270, representing 14% of all baptisms or 19% of all burials. These numbers are much smaller than expected, with a wide disparity (Table 3). Fees were due to the priest for burial and it might be the case that Giggleswick parents were unwilling to pay or unable to afford the fees and so did not have the death recorded in the parish register. The number of twins, 1.3% of baptisms, is in accord with other estimates of about 1.4% [Wrigley et al., 1997].
In the early years of registration the clerk did not consistently note the status of each person deceased. Those marked ‘infans’ in burial lists are virtually always to be found in the baptism lists (except for 1565 and 1566 with three infants not recorded in the baptism lists). The register is therefore not totally reliable as far as baptisms are concerned.
Life-expectancy
Estimates of the size of the population of England in post-Conquest centuries have been made by many authorities but they depend on a host of assumptions and estimates of life-expectancy [Wrigley et al., 1997; Hinde, 2003]. Tax lists and manor court rolls have been extensively considered as part of this effort. Parish registers have been used by others to determine individual family events, i.e. a process of family reconstitution, from which life-expectancy distributions can be obtained for both men and women for later centuries than the sixteenth (Tables 3 and 4). Whether these data apply to Elizabethan England has to be questioned since reliable data are scarce. Fieldhouse and Jennings [1978] studied Richmond and Swaledale and found, by reconstituting families that commenced with marriages between 1570 and 1620, that 15% of children died before the age of one and 25% before five years of age. Table 3 for all England shows much higher figures, which is a warning that the variation between parishes can be high.
Wrigley et al. [1997] show life-expectancy at birth in the period 1550 to 1600 as 33 rising to 40 years, males slightly higher than females. The research of others [Laurence, 1994] suggests typical life-expectancy at birth between 32 and 40 years. Life-expectancy values at birth are skewed by many early deaths of children, so some people lived to much greater ages than the life-expectancy values quoted here.
The generation of life-expectancy data for Giggleswick men and women has proved an unsatisfactory process. It is difficult to identify burial dates for men when sons were commonly given the same Christian name as their fathers, and it has proved unsafe to assume that the father has died before the son of the same name. Men (younger sons in particular it may be presumed) commonly moved away from the parish so burial dates are not found in many cases. Figures 3 and 4 show Giggleswick data which, however, are not considered reliable and life-expectancy cannot be calculated with much confidence. Computed weighted averages (using equal size age groups of 10 years) are exceptionally low. Agreement with Table 3 is not particularly close.
However, there are 98 reliable entries for married women in Giggleswick for whom we have ages at burial (Figure 5). The peak age is at 30 to 39 years, the weighted average is 43, and some women reach ages over 60. The average age is, of course, for women who have survived childhood years and is much greater than life-expectancy at birth. It has to be borne in mind that only about half of baptized females got married (513 marriages, 951 female baptisms — many dying before marriageable age, or being unmarried). The numbers of married women in the child-bearing year range of 20 to 40 indicate that 45% die in that age range, much higher than the 15% shown in Table 3 for both sexes, married and unmarried, because this latter figure includes children.
Marriage ages
Table 1 shows that the average age for marriage for men in this period is about 29 and that for women 24 years. Other authors give similar values [Hinde, 2003; Wrigley et al., 1997; Armstrong, 1994]. Second marriages are difficult to be sure about, but did happen when a first wife died leaving a husband with young children, or vice-versa. Just one or two cases might be identified with certainty in Giggleswick, but surely more are hidden in the register. Men probably had to wait to inherit the family tenement on their father’s death before being in a position to marry; perhaps half of young people were fatherless at the time of first marriage [Cressy, 1999]. There is evidence to indicate that many moved out of Giggleswick since no entries are found for child baptisms or burials following marriage. Very few married in late teenage years.
Marriage and Childbirth
Before a formal marriage ceremony took place in church there was a practice common in this period and later of pre-marital sex following betrothal, regarded as a contract of marriage. This contract was required neither in law nor by the church. ‘A powerful cultural current permitted betrothed couples to risk each other’s chastity in anticipation of matrimony’ [Cressy, 1999]. Wrigley et al. [1997] suggest that 30% of couples were betrothed formally, which was a state of legal inevitability of marriage. Customs varied from one part of the country to another: Laslett [1971, 150] gives details from Leicestershire for 1558. He quotes: ‘ ... any man being a suitor to a woman in the way of marriage is upon the day appointed to make a final conclusion of the marriage before treated of. If the said marriage be concluded and contracted then the man doth most commonly remain in the house where the woman doth abide the night the next following after such contract ...’ He suggests that brides in Leicestershire must normally have gone to their weddings in a state of pregnancy. In Warwickshire, among the pregnant brides married in Stratford-on-Avon in 1582 was Anne Hathaway, William Shakespeare’s wife, three months pregnant. Wrigley et al. [1997, Table 7.27] considering the period 1538-1599 and averaging over a large number of parishes, show that 29% of births occurred fewer than nine months after marriage.
For Giggleswick parish it appears that many betrothed women in our area were pregnant before marriage in church. Because some married women moved away from the parish shortly after marriage, only those women who had children in the parish were checked. Of these, in the cohort 1558-1567/8 about 31% gave birth two to seven months after marriage; for the cohort 1568-1577/8 about 19%, one to eight months later; for the cohort 1578-1587/8 about 21%, three to seven months after; and for the cohort 1588-1597/7 33%, five to seven months after marriage. The average is 25% but this can only be an approximate figure.
Laslett [1971] and Cressy [1999] demonstrate that people had a different view from that of the clergy of marriage and of the time when its privileges began. Community opinion and official doctrine were not aligned, and any contract before witnesses was a defence against a charge of immorality. The vicar of Giggleswick, Christopher Shute, married in August 1581 and Margareta was born in July 1582, he presumably obeying official doctrine. Marriage contracts were abolished in the Catholic world in 1564, the Pope directing that all marriages should be performed in church by a priest. In England espousals were abolished in 1753 — at least in principle.
There are suggestions that the practice of pre-marriage contracts was a way of testing whether a chosen bride was fertile and thus able to produce children to assist the family and later take over the farm or business. There are problems with this view, if one party proved to be infertile. Did the couple mutually agree not to proceed with the contract? Contracts were often informal, unwitnessed or improperly performed or insincere. Negotiations between families about jointure and portions could fail. There are cases in which one party had previously contracted marriage or betrothal with one person and was legally deemed unable to marry another [Cressy, 1999]. The term ‘handfasting’, meaning a probationary form of marriage, was first encountered in literature in 1530, and continued to be popular for centuries.
There is very little evidence of illegitimate births, being about 2% of all baptisms (Table 2), much lower than the 3.8% given by Wrigley et al. [1997]. Mortality or amnesia claimed some prospective husbands [Cressy, 1999]. Some women were the casualties of exploitative relationships as well as broken contracts. Some births may not have been registered with the church authorities, but it is unreasonable to claim that Craven was somehow different to the rest of England. Cressy [1999] suggests that parochial discipline was weaker in the north of England, but there seems to be no evidence for this in Giggleswick.
Recorded instances of maternal death probably due to childbirth have been identified by checking if a child was baptized or buried around the time of the mother’s burial, but there are surprisingly few reasonably certain cases found (Table 5). However, the number of women labelled ‘ux’ (wife) in the year of these burials is used as a reference point, together with the age of the wife at burial to eliminate much older women. It is found that 8% (in the plague year of 1597) and 25% to 33% in other years are the percentages of wives dying in childbirth of the total number of wives dying. The number of cases is so small, and other women buried may not have been noted as wives, that these figures must be treated with caution. There must have been many other years in which mothers died in childbirth but these are not found in the register. If the child was not baptized and the mother died in childbirth the register cannot be used to prove that this was the cause of death.
Armstrong [1994] stated that 14% of mothers died in childbirth in Greystoke in Cumbria. Fieldhouse and Jennings [1978] quote 16% women dying in childbirth or within two weeks. In contrast Wrigley et al. [1997] quote 1.2% maternal mortality for 1580-1599. Why such substantial variation? Currently maternal mortality is about 0.01% in the UK falling from about 1% in 1800 [MBRRACE-UK 2017].
In some years (1581, 1587, 1588, and particularly 1597) the number of wives’ deaths seems very much worse, perhaps due to some epidemic or starvation distress. There was large-scale mortality in the country at large in 1587, 1588,1597, and 1598. As alternative evidence for maternal mortality one can look for some clear relationship between the number of children born in any one year (baptisms) and wife mortality in that year. Unfortunately, it has not proved possible to find such a relationship.
The number of baptisms (1947) and number of wives (513 marriages) appear reasonably reliable for the whole 40-year time span. There are about four children per wife over her child-bearing lifetime (say about twelve years — i.e. child-bearing every three years or so) and maybe 92% child survival by the end of the first year or so (i.e. 7.6% infant burials). A figure of 86% survival (i.e.14% infant mortality) has been quoted elsewhere [www.bbc.co.uk]. Reynolds [1979] quotes 85% (male) and 84% (female) infant survival. Currently the UK rate is about four child deaths per 1000 live births (99.6% survival). For infant deaths up to one year old there are about 81 males and 59 females over the 40-year period. Female babies have been said to be more susceptible to disease such as whooping cough; these figures do not support that contention but should again be treated with caution.
Unmarried women
The lives of single women of marriageable age and above feature much less prominently in the documents of the period. The burial registers give only one case, in 1572, of a woman labelled ‘innupta’ (unmarried), though there were obviously more such women buried, the clerk using another description or none. Moody [2019] has analysed the wills of the period made by women (available at www.dalescommunityarchives.org.uk). Although wives and daughters often appear as beneficiaries in male wills, very few women at all made wills at this time; in this parish between 1558 and 1603 only those of thirteen widows and seven unmarried women have been found — out of a total of 172. Only three of these were given descriptions: one was called ‘daughter’; in 1566 Jennet Stachowse of Langcliffe was described as ‘singlewoman’, and in 1587 Elizabeth Carre, also of Langcliffe, was described as a ‘spinster’. This word is very commonly used nowadays for an unmarried female, but it only came into use as such in the second quarter of the 16th century. Previously signifying a woman whose occupation was a spinner, in this period it became the proper legal definition of a woman who remained unmarried. The Shorter Oxford Dictionary gives the first recorded example of this use in London in 1564; here we have the term 23 years later, and in the 17th century it gradually became more usual [Hill, 2001].
Population estimates
Population estimates can be made, ignoring flows in and out of the parish, by using the total number of burials per year and multiplying by the average age in that population. Generally, independent estimates of either population numbers or average age are lacking. However, relative life-expectancy between men and women can be calculated to allow making a rough estimate of population size (Appendix).
For baptisms the sex-ratio male/female is 1.05:1 and for all burials the sex-ratio male/female is 1.023. The average sex-ratio for the population for these years is generally thought to be near 1.05 (more men than women in the population) [Reynolds, 1979]. Using these ratios the (male life-expectancy)/(female life-expectancy) is 1.07. This suggests that the life-expectancy of males at birth was about 7% longer than for females but is subject to the assumptions made. Laurence [1994] says that women tended to live longer than men; but women were much more likely to die in the first ten years of marriage, and thereafter, if they survived, lived to greater ages than men.
A new method of estimating life-expectancy at birth using cross-correlation of annual variations of baptisms and burials gives a value for Giggleswick parish of 27 years life-expectancy. Hence this means a total population for Giggleswick Ancient Parish of {(719+703)/40} x 27 = 960. The Giggleswick Manor Court records show the number of tenants, both free and at-will to be about 85 in the later years of Elizabeth’s reign; if there were about 4.5 persons in each of these tenancies (a generally accepted figure) the population of Giggleswick Manor would be about 380. (The number of children per marriage here is about 3.8, some of whom die at an early age and to which are added the two parents). To this number of 380 inhabitants must be added the numbers in Langcliffe, Rathmell, Settle and Stainforth. The number of all tenants for Settle from court records is about 100, giving about 450 inhabitants. There are no equivalent records for the three other smaller manors. The Ancient Parish total is therefore probably just over 1000. Conclusion
Detailed study of the Giggleswick Parish Register is rewarding for information about women’s and children’s lives, as long as due care is taken to see the flaws due to inaccurate or inadequate recording of information. Valuable evidence about women’s and children’s lives in our area can be teased out with a good degree of confidence - such information not obtainable elsewhere in documents of the time. The data extracted agree with national data apart from apparently low burial rates for infants. Information on maternal death due to childbirth is scant. Married women, having survived childhood, died at an average age of 43 years and some lived to the age of 80. Using burial rates and sex-ratios it is possible to calculate that men’s lives were a little longer than women’s, but a large difference in life-expectancy between males and females is not clearly proven.
While many of the possible conclusions are similar to those found for conditions elsewhere in the country, this investigation of a particular north country parish indicates that substantial local variation can be expected and that behaviour norms of ordinary folk, as far as betrothal matters and pre-nuptial births are concerned, were not those favoured by the church authorities.
Acknowledgement
Dr Sylvia Harrop provided material support, advice and encouragement for this work for which the author is very grateful.
References,
General Bibliography and Appendix are in the web version of this article.
Table 1 Basic data
| Cohort | Male baptisms (BPs) | Female baptisms (BPs) | Marriages | Male average age at marriage | Female average age at marriage | Male burials | Female burials |
| 1558-1567/8 | 240 | 240 | 69 | 30 | 24 | 141 | 131 |
| 1568-1577/8 | 302 | 302 | 161 | 28 | 25 | 210 | 179 |
| 1578-1587/8 | 207 | 193 | 144 | 30 | 23 | 180 | 185 |
| 1588-1597/8 | 247 | 216 | 139 | 27 | 24 | 188 | 208 |
| Totals or | 996 | 951 | 513 | 29 | 24 | 719 | 703 |
Table 2 Derived data
| Cohort | Infant burials (0 to 1y) | Infant burials (0 to 4y) | Infant burials (0-1y) per no. of BPs % | Twins | Twins BPs % | Illegitimate | Illeg./BPs % | BPs per Marriage | Male BPs/Female BPs |
| 1558-1567/8 | 15 | 60 | 3.1 | 4 | 0.83 | 11 | 2.3 | 3.86 | 1.000
|
| 1568-1577/8 | 54 | 62 | 8.9 | 6 | 0.99 | 13 | 2.2 | 3.75 | 1.000 |
| 1578-1587/8 | 33 | 86 | 8.3 | 5 | 1.25 | 8 | 2.0 | 2.78 | 1.073 |
| 1588-1597/8 | 38 | 62 | 8.2 | 10 | 2.16 | 9 | 1.9 | 3.33 | 1.144 |
| Totals or Averages | 140 | 270 | 7.2 | 25 | 1.28 | 41 | 2.1 | 3.80 | 1.047 |
Table 3 Distributions of age at death for different life-expectancies in England, male and female
| Age group | % of deaths in age group for different life-expectancies at birth | ||
| Age group | 20 years | 30 years | 40 years |
| 0-4 | 50 | 39 | 27 |
| 5-19 | 10 | 8 | 7 |
| 20-39 | 15 | 14 | 13 |
| 40-59 | 13 | 16 | 17 |
| 60-69 | 7 | 11 | 14 |
| 70-79 | 4 | 9 | 15 |
| 80+ | 1 | 3 | 7 |
| Totals | 100 | 100 | 100 |
| (ex. Hinde, 2003. Values for 20 years determined by extrapolation). | |||
Table 4 Life-expectancies (years) in England, male and female
| Date | 1558 | 1563 | 1568 | 1573 | 1578 | 1583 | 1588 | 1593 | 1598 |
| Life-expectancy | 22.4 | 36.7 | 39.7 | 47.1 | 41.6 | 42.7 | 37.1 | 38.1 | 38.5 |
Table 5 Some Maternal deaths due to childbirth
| Jane Browne (md William Browne), son Thomas bp 9 Sept. 1604, bd 27 Sept. 1604, aged 36. |
| Margaret Somerscales (md William Lunde), son Richard bp 3 Apr. 1597, bd 23 July 1597, aged 25. |
| Agnes Foster (md John Clapeham), dau. Isabella bp 12 July 1590, bd 21 May 1590, aged 16. |
| Elizabeth Linsaie (md Thomas Tailer), dau. Elizabeth bp 28 Jan. 1620/1, bd 20 Apr. 1621, aged 36. |
| Anne Wharffe (md James Carr), dau. Ellen bp 15 Jan. 1614/5, bd 17 Jan. 1614/15, aged 36. |
References
- Armstrong, D., 1994. Birth, marriage and death in Elizabethan Cumbria. Local Population Studies, No.53, p29
- Brayshaw, T. and Robinson, R.M., 1932. A history of the ancient parish of Giggleswick. London.
- Cressy, D., 1999. Birth, marriage and death. Ritual, religion and the life-cycle in Tudor and Stuart England, OUP.
- Fieldhouse, R., 1971. A comment on population studies with particular reference to North West Yorkshire 1377-1563. Cleveland and Teesside Local Hist. Soc. Bull., No. 12, pp7-10.
- Fieldhouse. R. and Jennings, B., 1978. A history of Richmond and Swaledale. Phillimore.
- Gandy, I., 1989. Round about the little steeple. The story of a Wiltshire parson 1573-1623. Sutton.
- Hill, Bridget, 2001. Women alone. Spinsters in England 1660-1850. Yale, pp 4-5.
- Hinde, A., 2003. England’s population. A history since the Domesday survey. OUP.
- Hoyle, R.W., ed., 1984. The Parish Register of Giggleswick, vol. 1. 1558-1569. Yorkshire Archaeological Society.
- Laslett, P., 1971. The world we have lost. Methuen.
- Laurence, A.E., 1994. Women in England 1500-1760. Phoenix Press, London.
- Moody, C., 2019. The wills of women in 16th century North Craven. North Craven Heritage Trust Journal, pp16-20.
- Reynolds, G., 1979. Infant mortality and sex ratios at baptism as shown by reconstitution of Willingham, a parish at the edge of the Fens in Cambridgeshire. Local population Studies Journal, No. 22, p31.
- Whiting, C., 1949. Parish Registers. The Yorkshire Archaeological Journal, part 146, 2nd part of vol. 37. pp131-144.
- Wrigley, E.A., 1969. The use of the description ‘Widow’ in Parish Registers. Local population Studies Journal, No. 3, p17.
- Wrigley, E.A., Davies, R.S., Oeppen, J.E. and Schofield, R.S., 1997. English population history from family reconstitution 1580-1837. CUP
- https://ourworldindata.org/maternal-mortality
- https://en.wikipedia.org/wiki/Demography_of_the_United_Kingdom
- http://www.bbc.co.uk
- http://www.dalescommunityarchives.org.uk.
General bibliography
- Fieldhouse, R. and Jennings, B., 1978. A history of Richmond and Swaledale, Phillimore
- Laslett, P., 1969. Size and structure of the household in England over three centuries, Local Population Studies, vol. 23, pp199-223
- Wrigley, E.A. and Schofield, R.S., 1989. Population history of England 1541-1871. CUP
Appendix
We have 996 male children and 951 female children baptized between 1558 and 1597/8, sex-ratio male/female = 1.05:1. (Laurence [1994] quotes 1.05 for baptisms, Reynolds [1979] quotes 1.15).The sex-ratio for all burials male/female is 719/703 = 1.023.
If we use the approximate ratio (which neglects inflows and outflows)
population of males/population of females =
|
[(male deaths/year) × male life-expectancy]
[(female deaths/year) × female life-expectancy] |
If we also assume that the overall population sex-ratio is 1.05:1 we can then state that
(male life-expectancy)/( female life-expectancy) = (17.98/17.58) x 1.05 = 1.07
This value of 1.07 suggests that the life-expectancy of males at birth was about 7% longer than for females, but is subject to the assumptions made.

Figure 1 Townships in The Ancient Parish of Giggleswick. ex Brayshaw and Robinson, 1932
Figure 3 Age distribution at death for males
Figure 4 Age distribution at death for females
Figure 5 Age distribution at death for married women
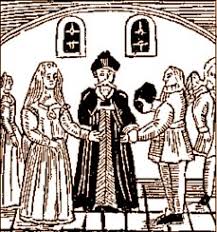
Figure 6 The marriage ceremony (http://internetshakespeare.uvic.ca)